Introduction
As technology becomes more accessible as well as more advanced, digital humanities scholars have looked to use it in novel and innovative ways. The field of archeology, although still rooted in hands-on work, has benefited from the use of satellite multispectral imaging to identify sites of interest and features that are invisible from the ground. Although this is a valuable tool, these images are expensive to acquire and the barrier that such costs create has left researchers in underserved areas or working with underserved populations with few opportunities to conduct multispectral surveys.
History from Above seeks to test the viability of a new kind of multispectral imaging by using drones instead of satellites to capture data about an archaeological site. This novel application to cultural heritage opens exciting new opportunities for primary research into historical sites by:
- Allowing scholars to assess vegetation patterns to discover otherwise indiscernible archeological sites and disturbances
- Revealing fine details from buildings and surfaces –inscriptions, paintings, etc.– that have been damaged and are invisible
- To make 3D multispectral models of historical sites that are not conducive to ground study alone
By comparatively analyzing the data collected, the study aims to determine the viability of using a drone for research on other, similar sites.
Goals
The primary goal of the study is to test a new technique in digital heritage imaging: multispectral drone photography and photogrammetry. Using data collected from a variety of sites across climates and archeological features, the study aims to determine the limits and capabilities of this data-capture technique, and see what viability, if any, drone capture has for research on differing archeological sites.
In capturing data, we are looking to test several variables to see how they affect the quality and use of the multispectral images.
- Differences in information collected when flights are completed just after sunrise and just before sunset
- Differences in information collected when flights are completed on different day with notes for weather
- Differences in information collected in comparison with other sites with different climatic conditions
Technology
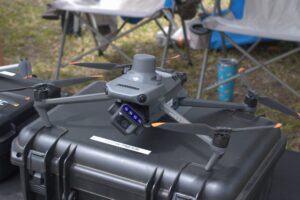
The Drone
Lorem ipsum dolor sit amet, consectetur adipiscing elit. Sed sit amet facilisis ex. Nam malesuada lorem a ex lacinia pellentesque. Proin sodales justo vitae mauris dignissim, sed tempor nibh maximus. Suspendisse vehicula commodo mattis. In in lacinia ex, eu gravida nunc. Etiam nisl dui, auctor non nulla eget, faucibus interdum dolor. Morbi pharetra, lectus id pharetra consectetur, urna elit facilisis neque, vulputate dapibus sapien leo eget sem. Sed massa ex, accumsan a nisl non, pulvinar posuere mi. Pellentesque vulputate elit ac turpis facilisis imperdiet. In pharetra quis ante quis rhoncus. Maecenas malesuada in arcu in rutrum. Praesent malesuada interdum purus, nec euismod felis eleifend eu. Curabitur feugiat tortor enim, nec pellentesque elit malesuada a.
Agisoft Metashape
Agisoft Metashape is an imaging processing software used primarily for photogrammetry. In this process, a series of overlapping images are stitched together to create a 3D model of an object, terrain, or other feature, which can then be exported into video game engines or used for study purposes. Metashape is widely used by archeologists for capturing data about their sites and finds.
In History from Above, metashape is being used to ?????
Data Capture
Image Output
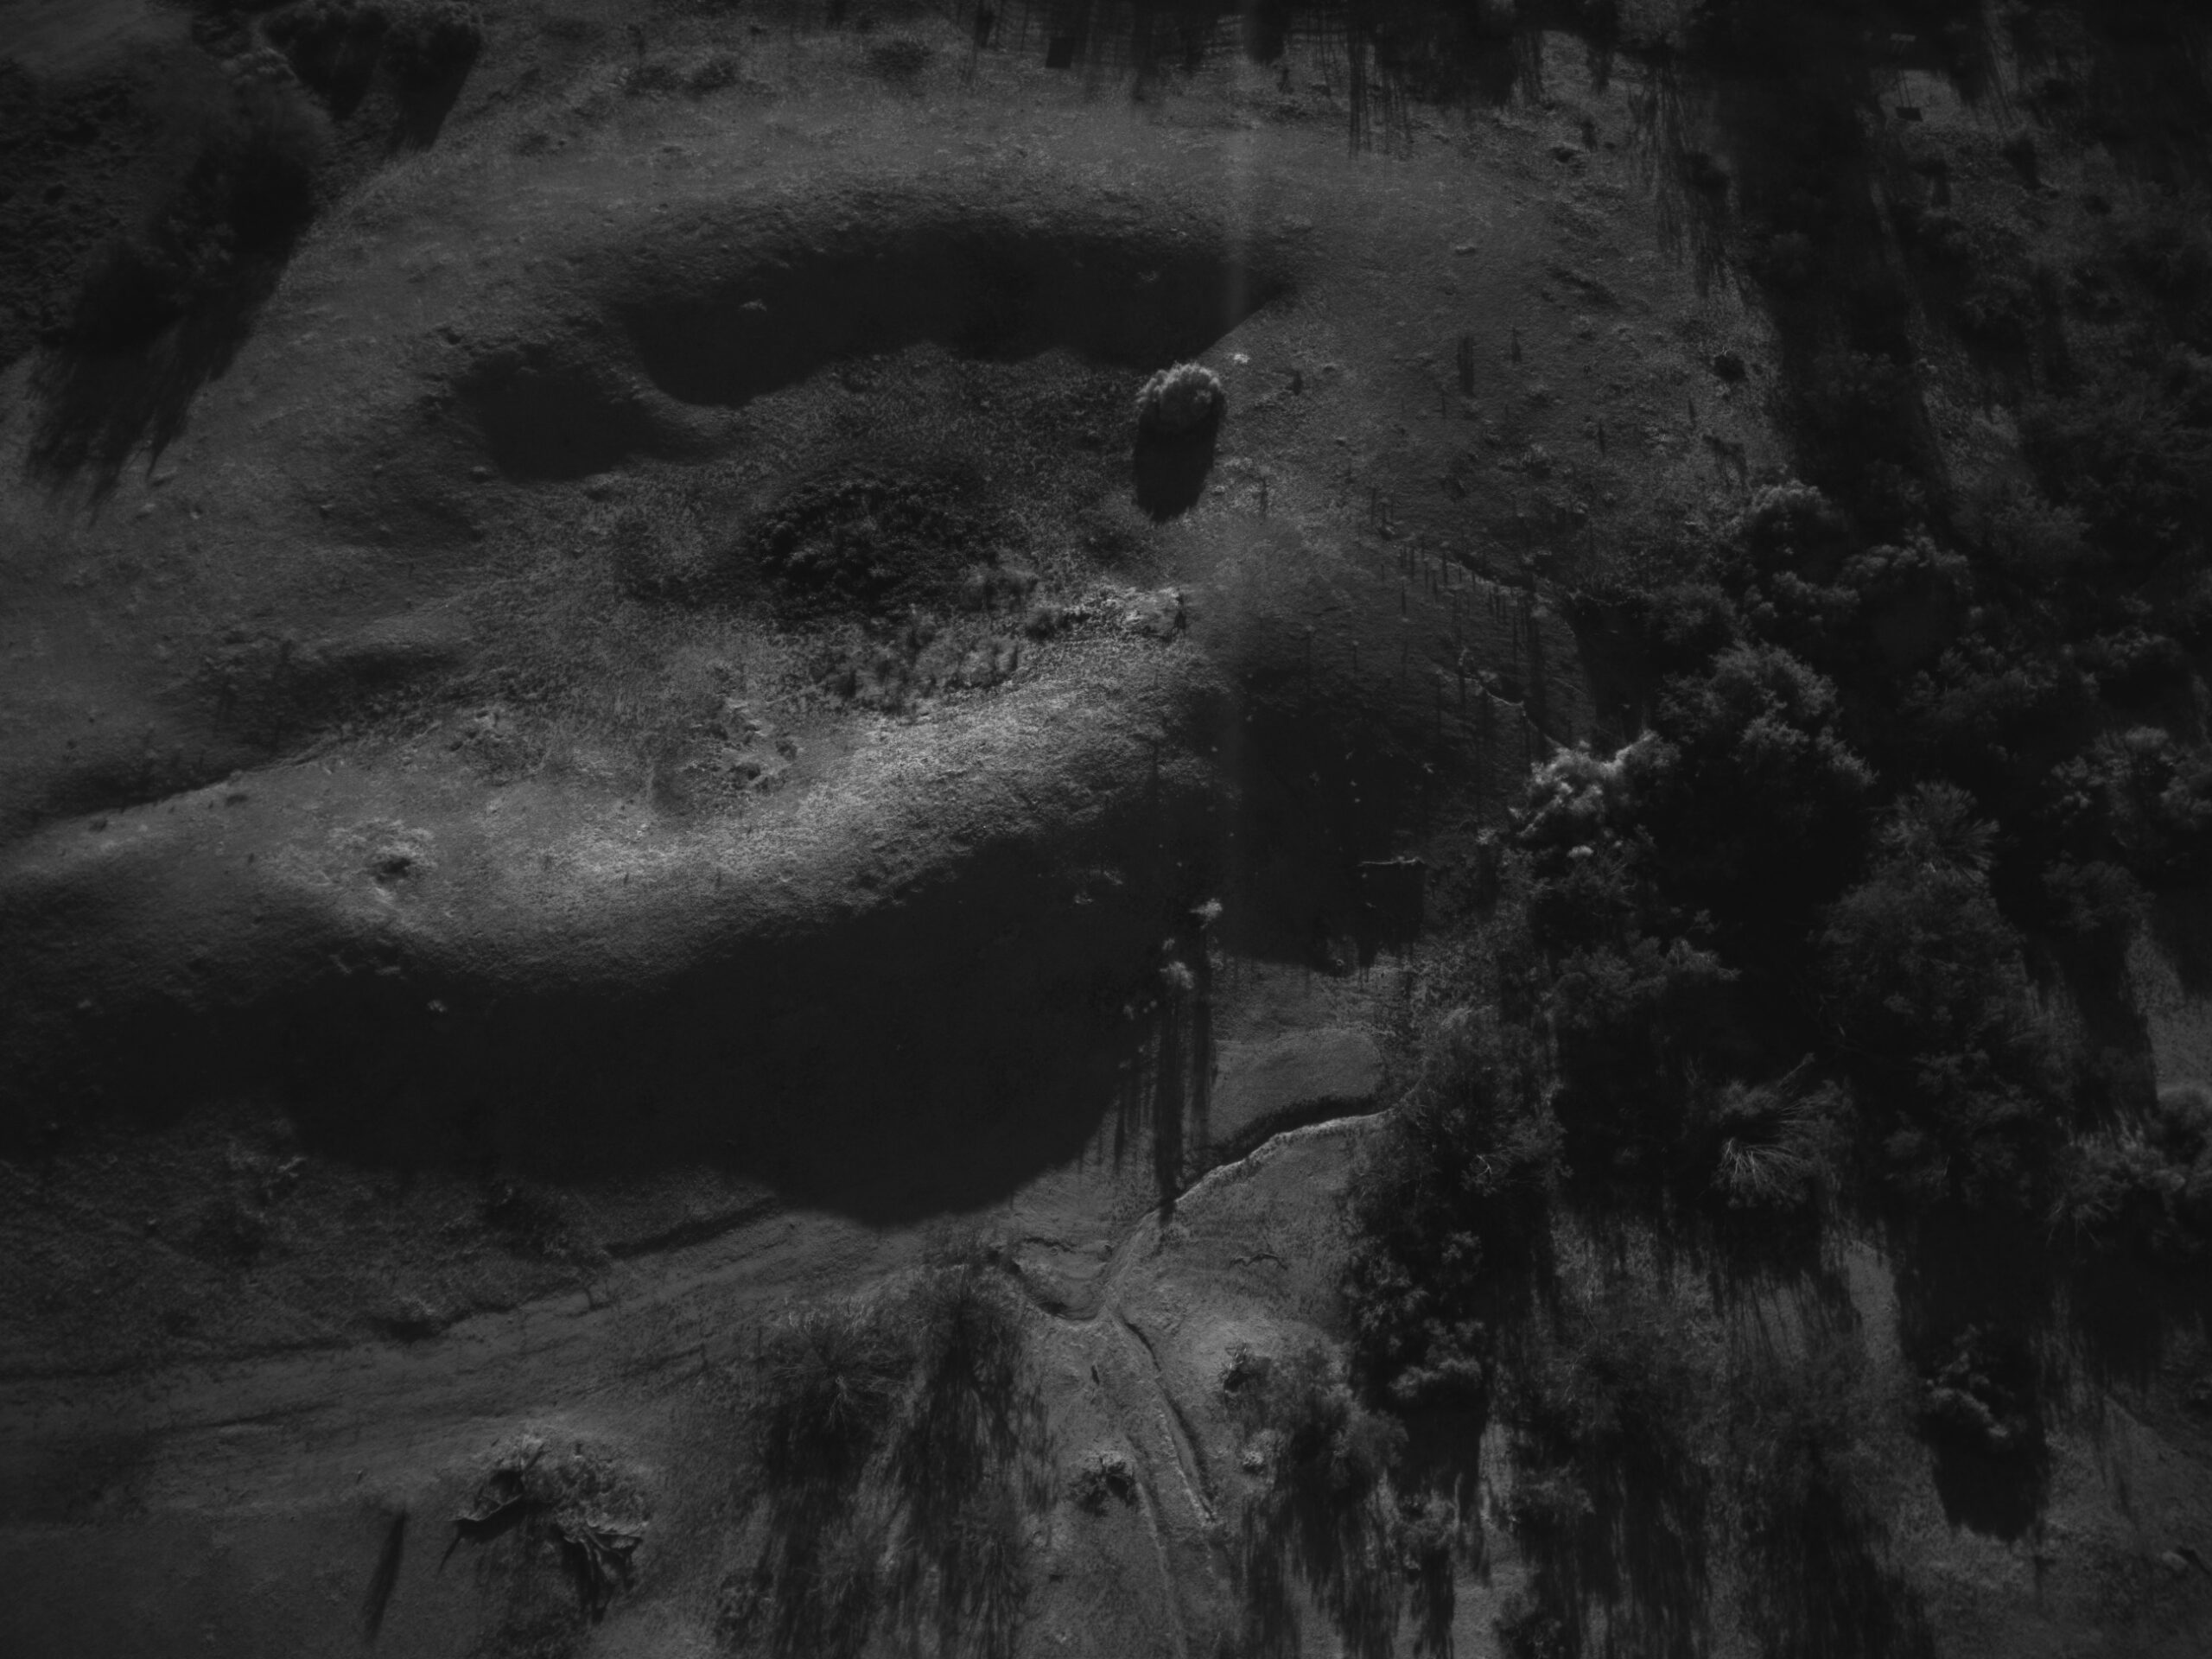
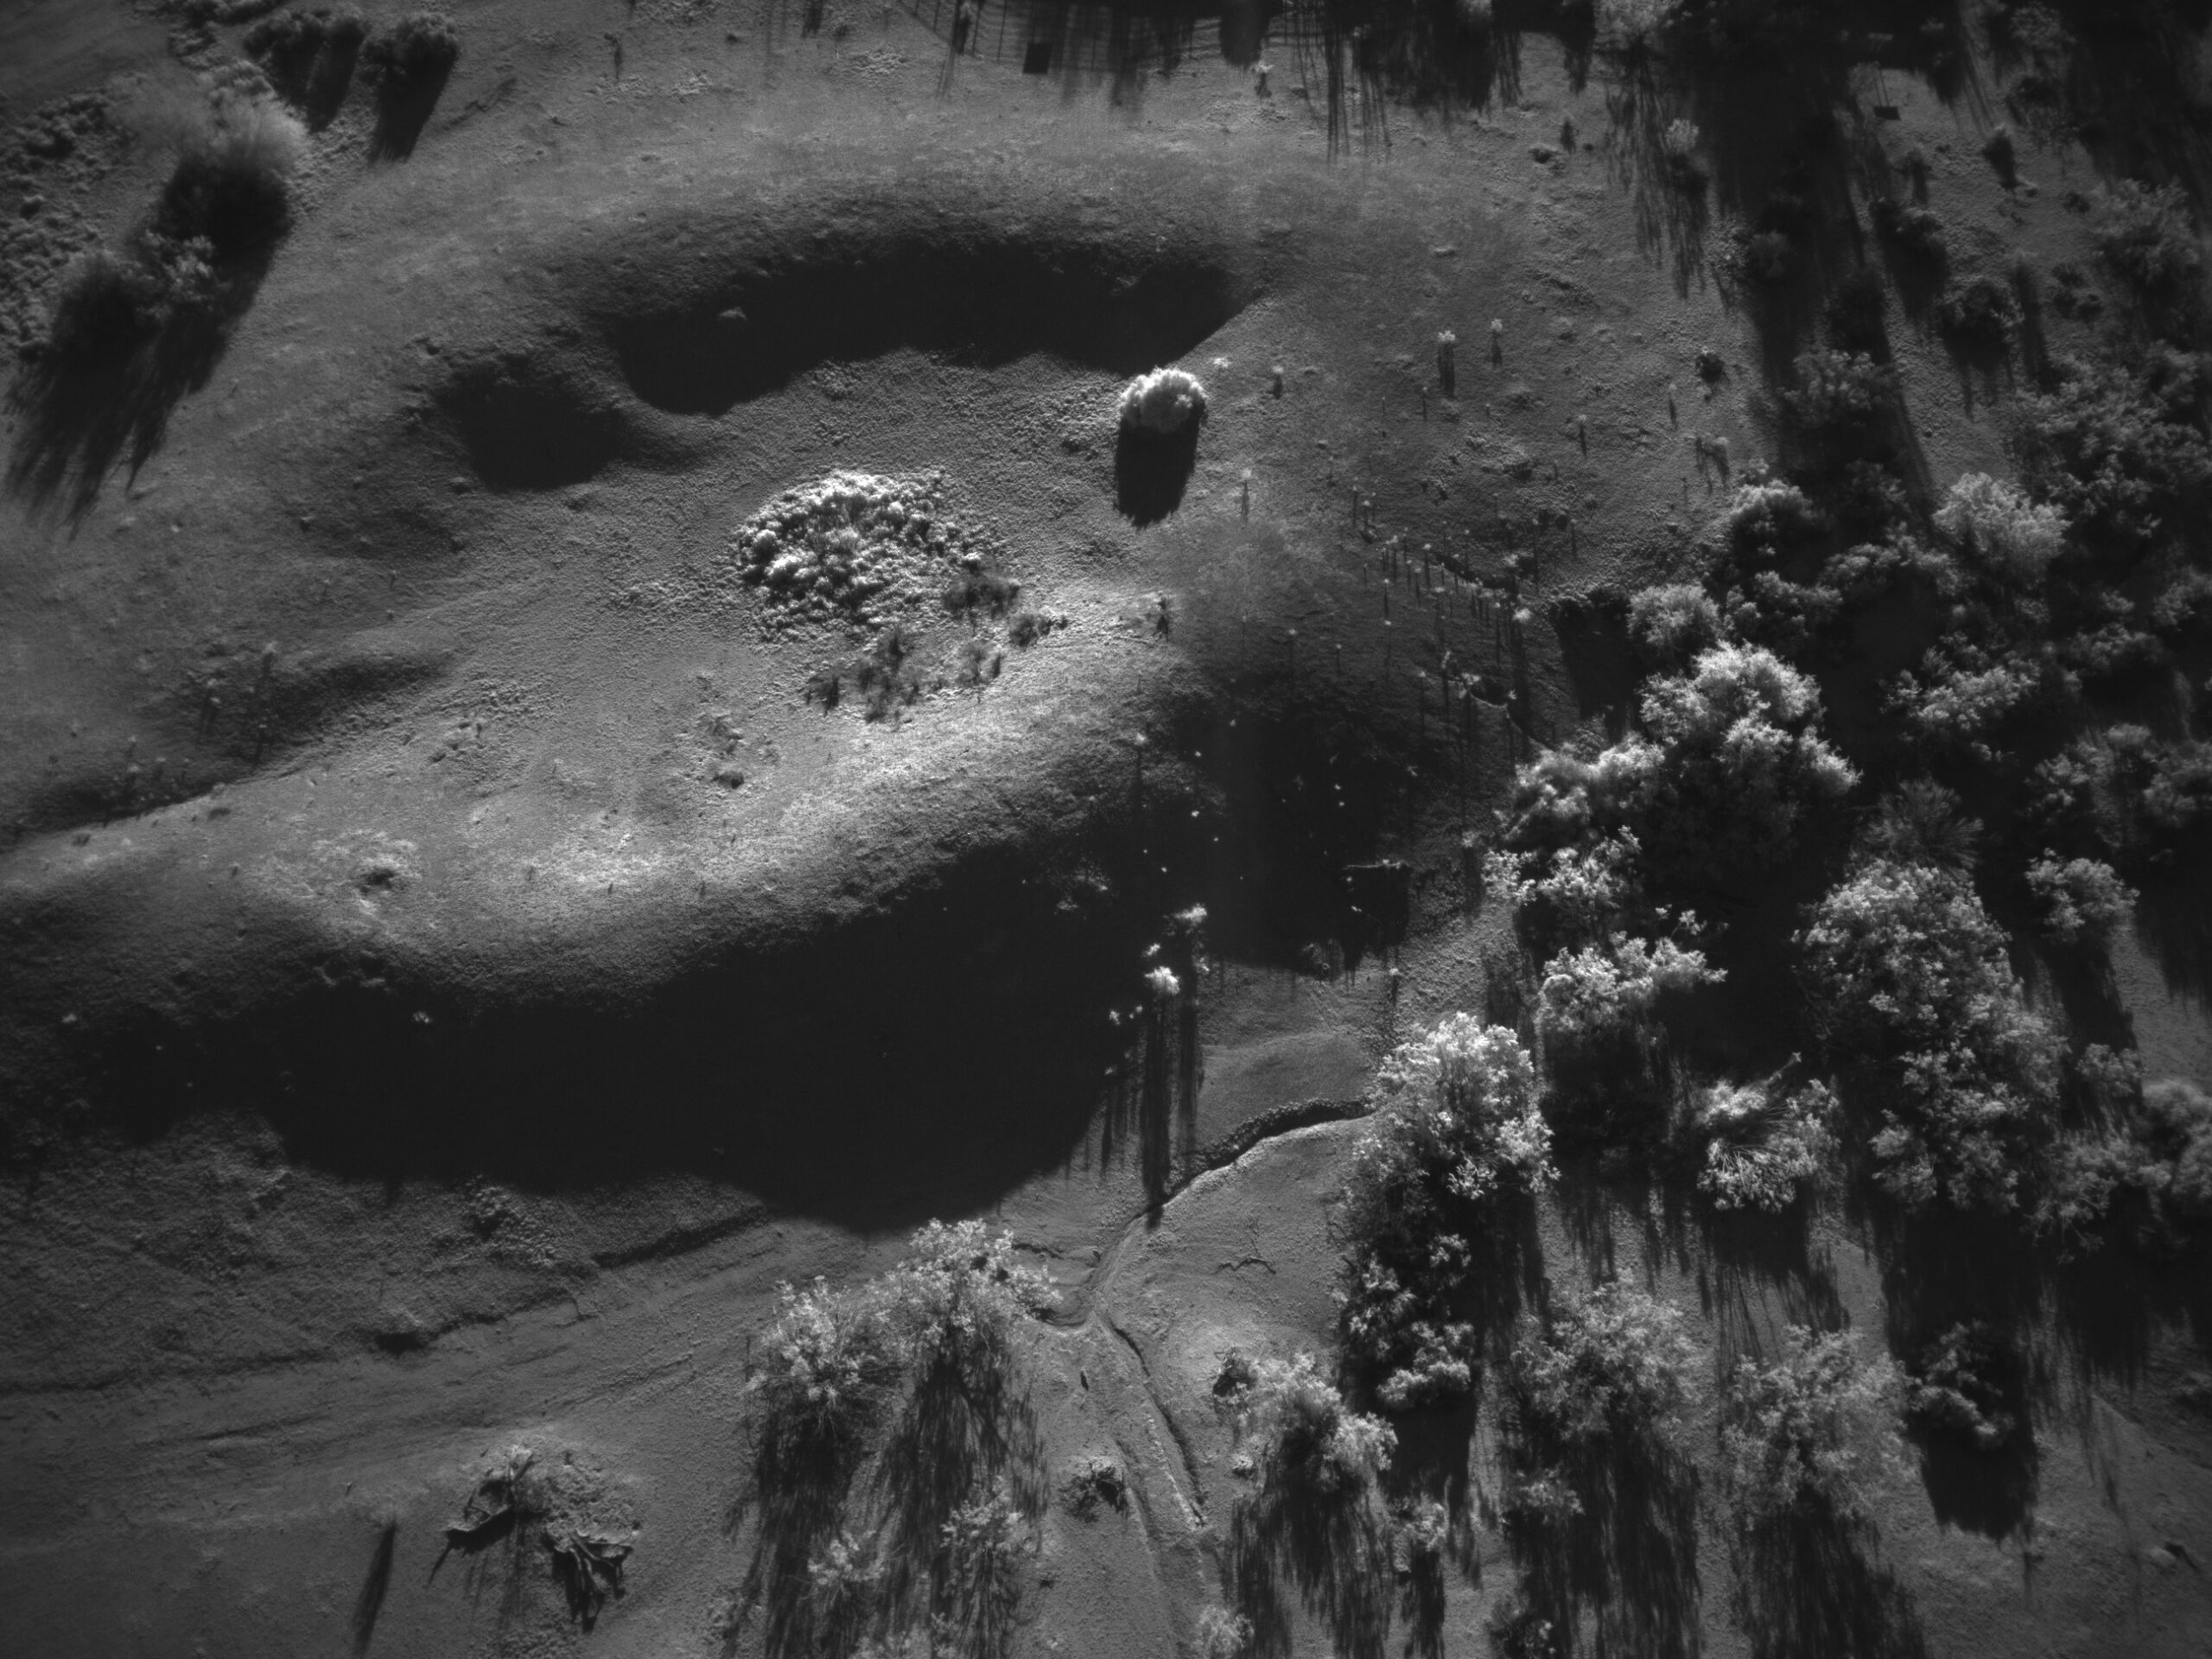
In multispectral imaging, a series of photographs are taken using different bands of light, and thus different wavelengths. Imaging documents or landscapes in this way can highlight or obscure certain features, making it a useful tool for seeing things that are not visible to the naked eye.
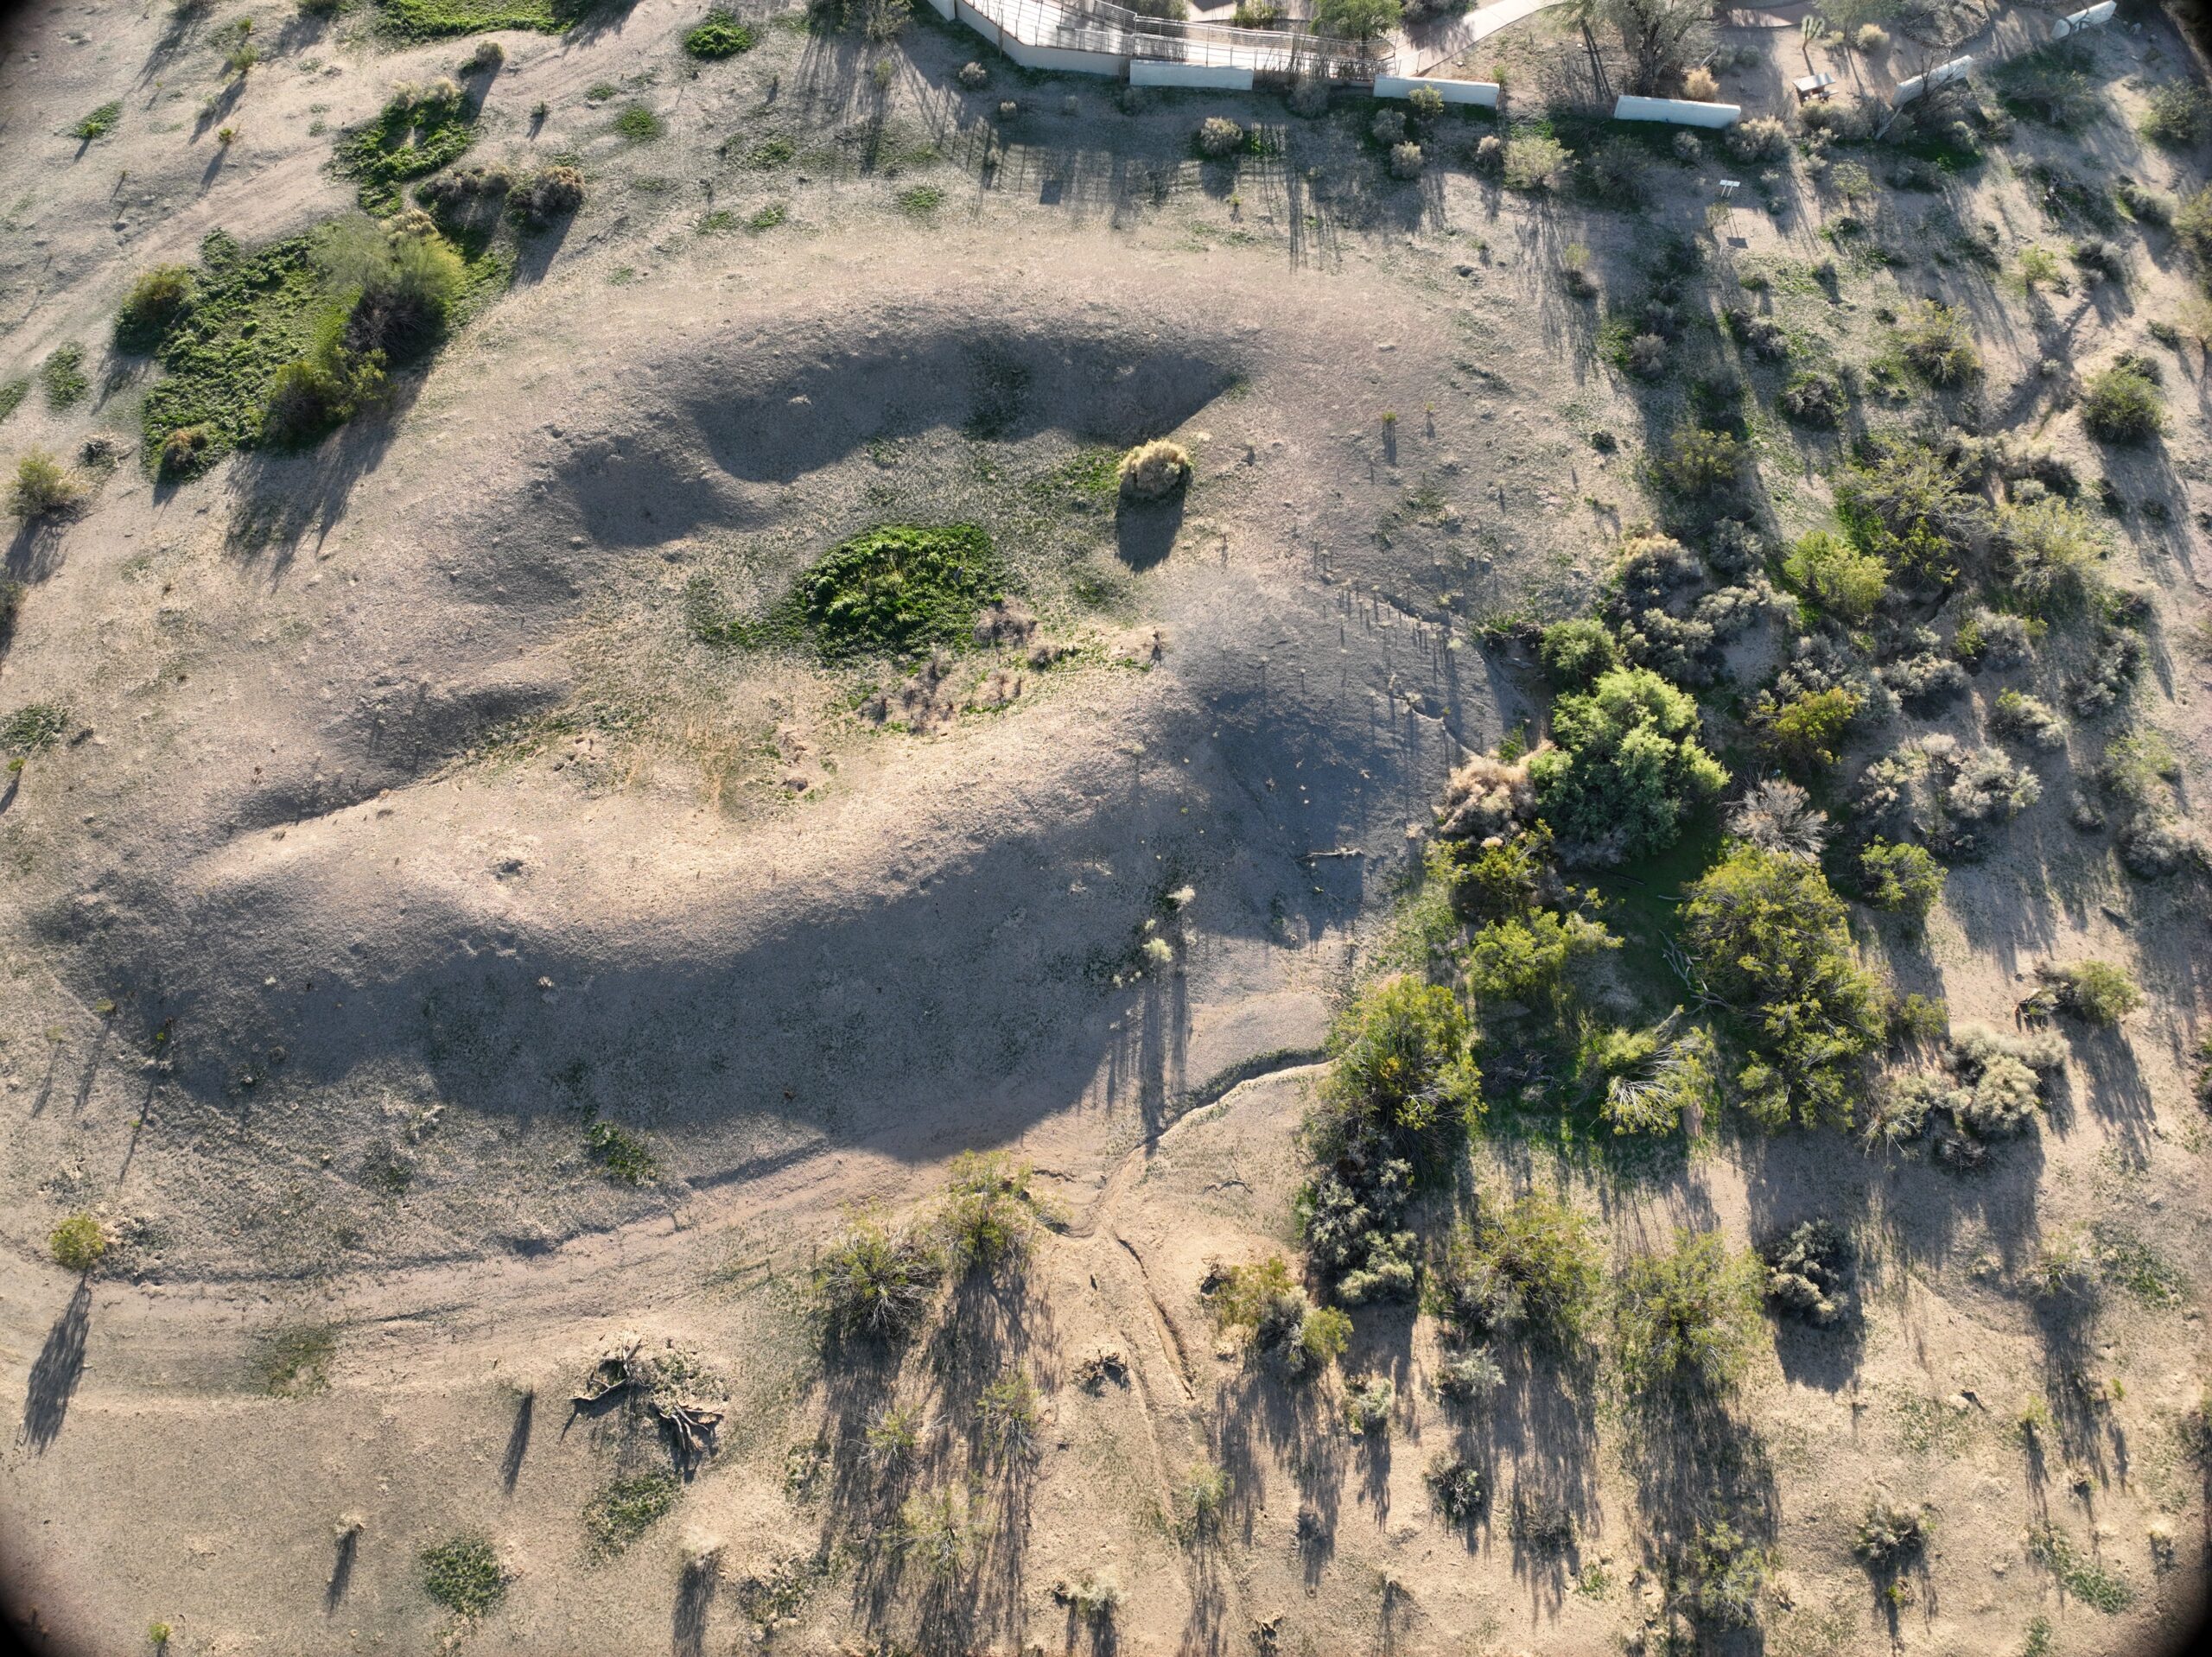
The below examples, captured at the ball court at Casa Grande Ruins National Monument, show the different light bands used with the drone data capture, and how each one reveals something different about the site.
RGB
This image is captured in RGB bands and shows what the site looks like in full color. This is how the site would appear to the naked eye from overhead.
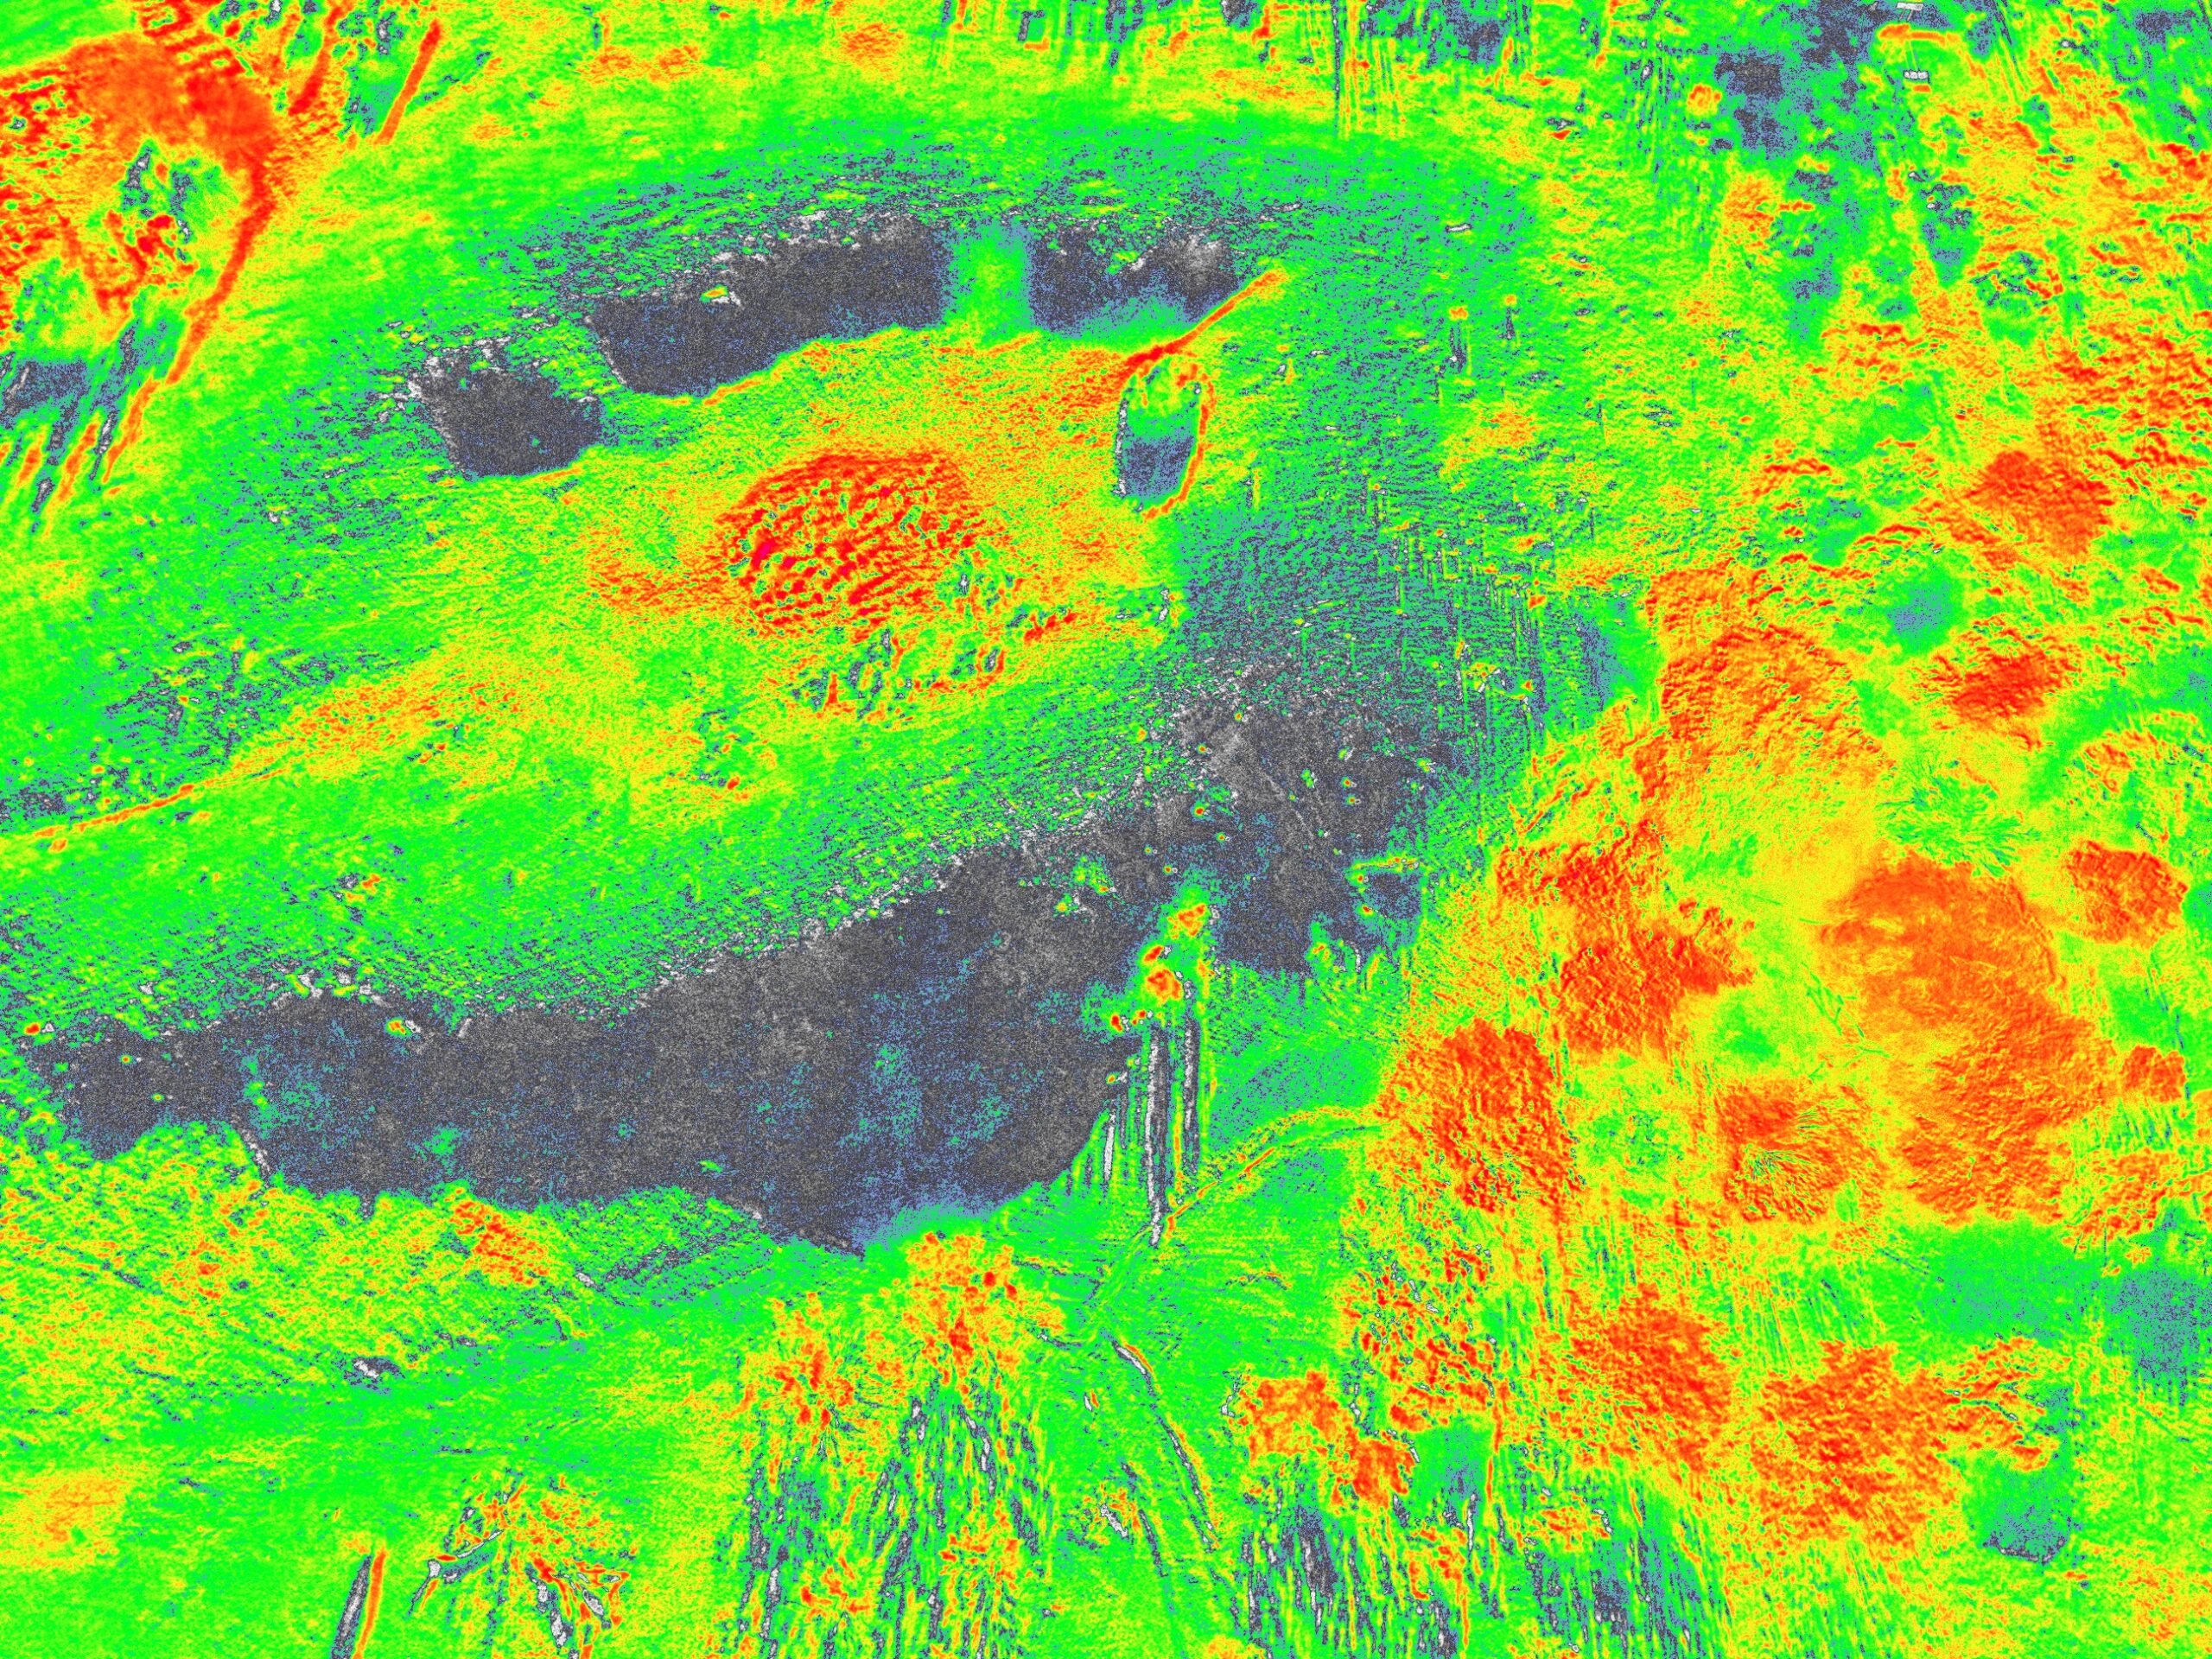
MSI/NDVI
This image was captured using normalized difference vegetation index (NDVI), which shows the health and density of vegetation in each area. This is done by taking images in red and near-infrared bands. In this image, the red areas show high vegetation, while blue shows no vegetation.
Red
Lorem ipsum dolor sit amet, consectetur adipiscing elit. Donec ex tellus, convallis consectetur est ac, vulputate convallis neque. Sed nec dui a felis scelerisque pharetra. Pellentesque molestie rutrum aliquam.
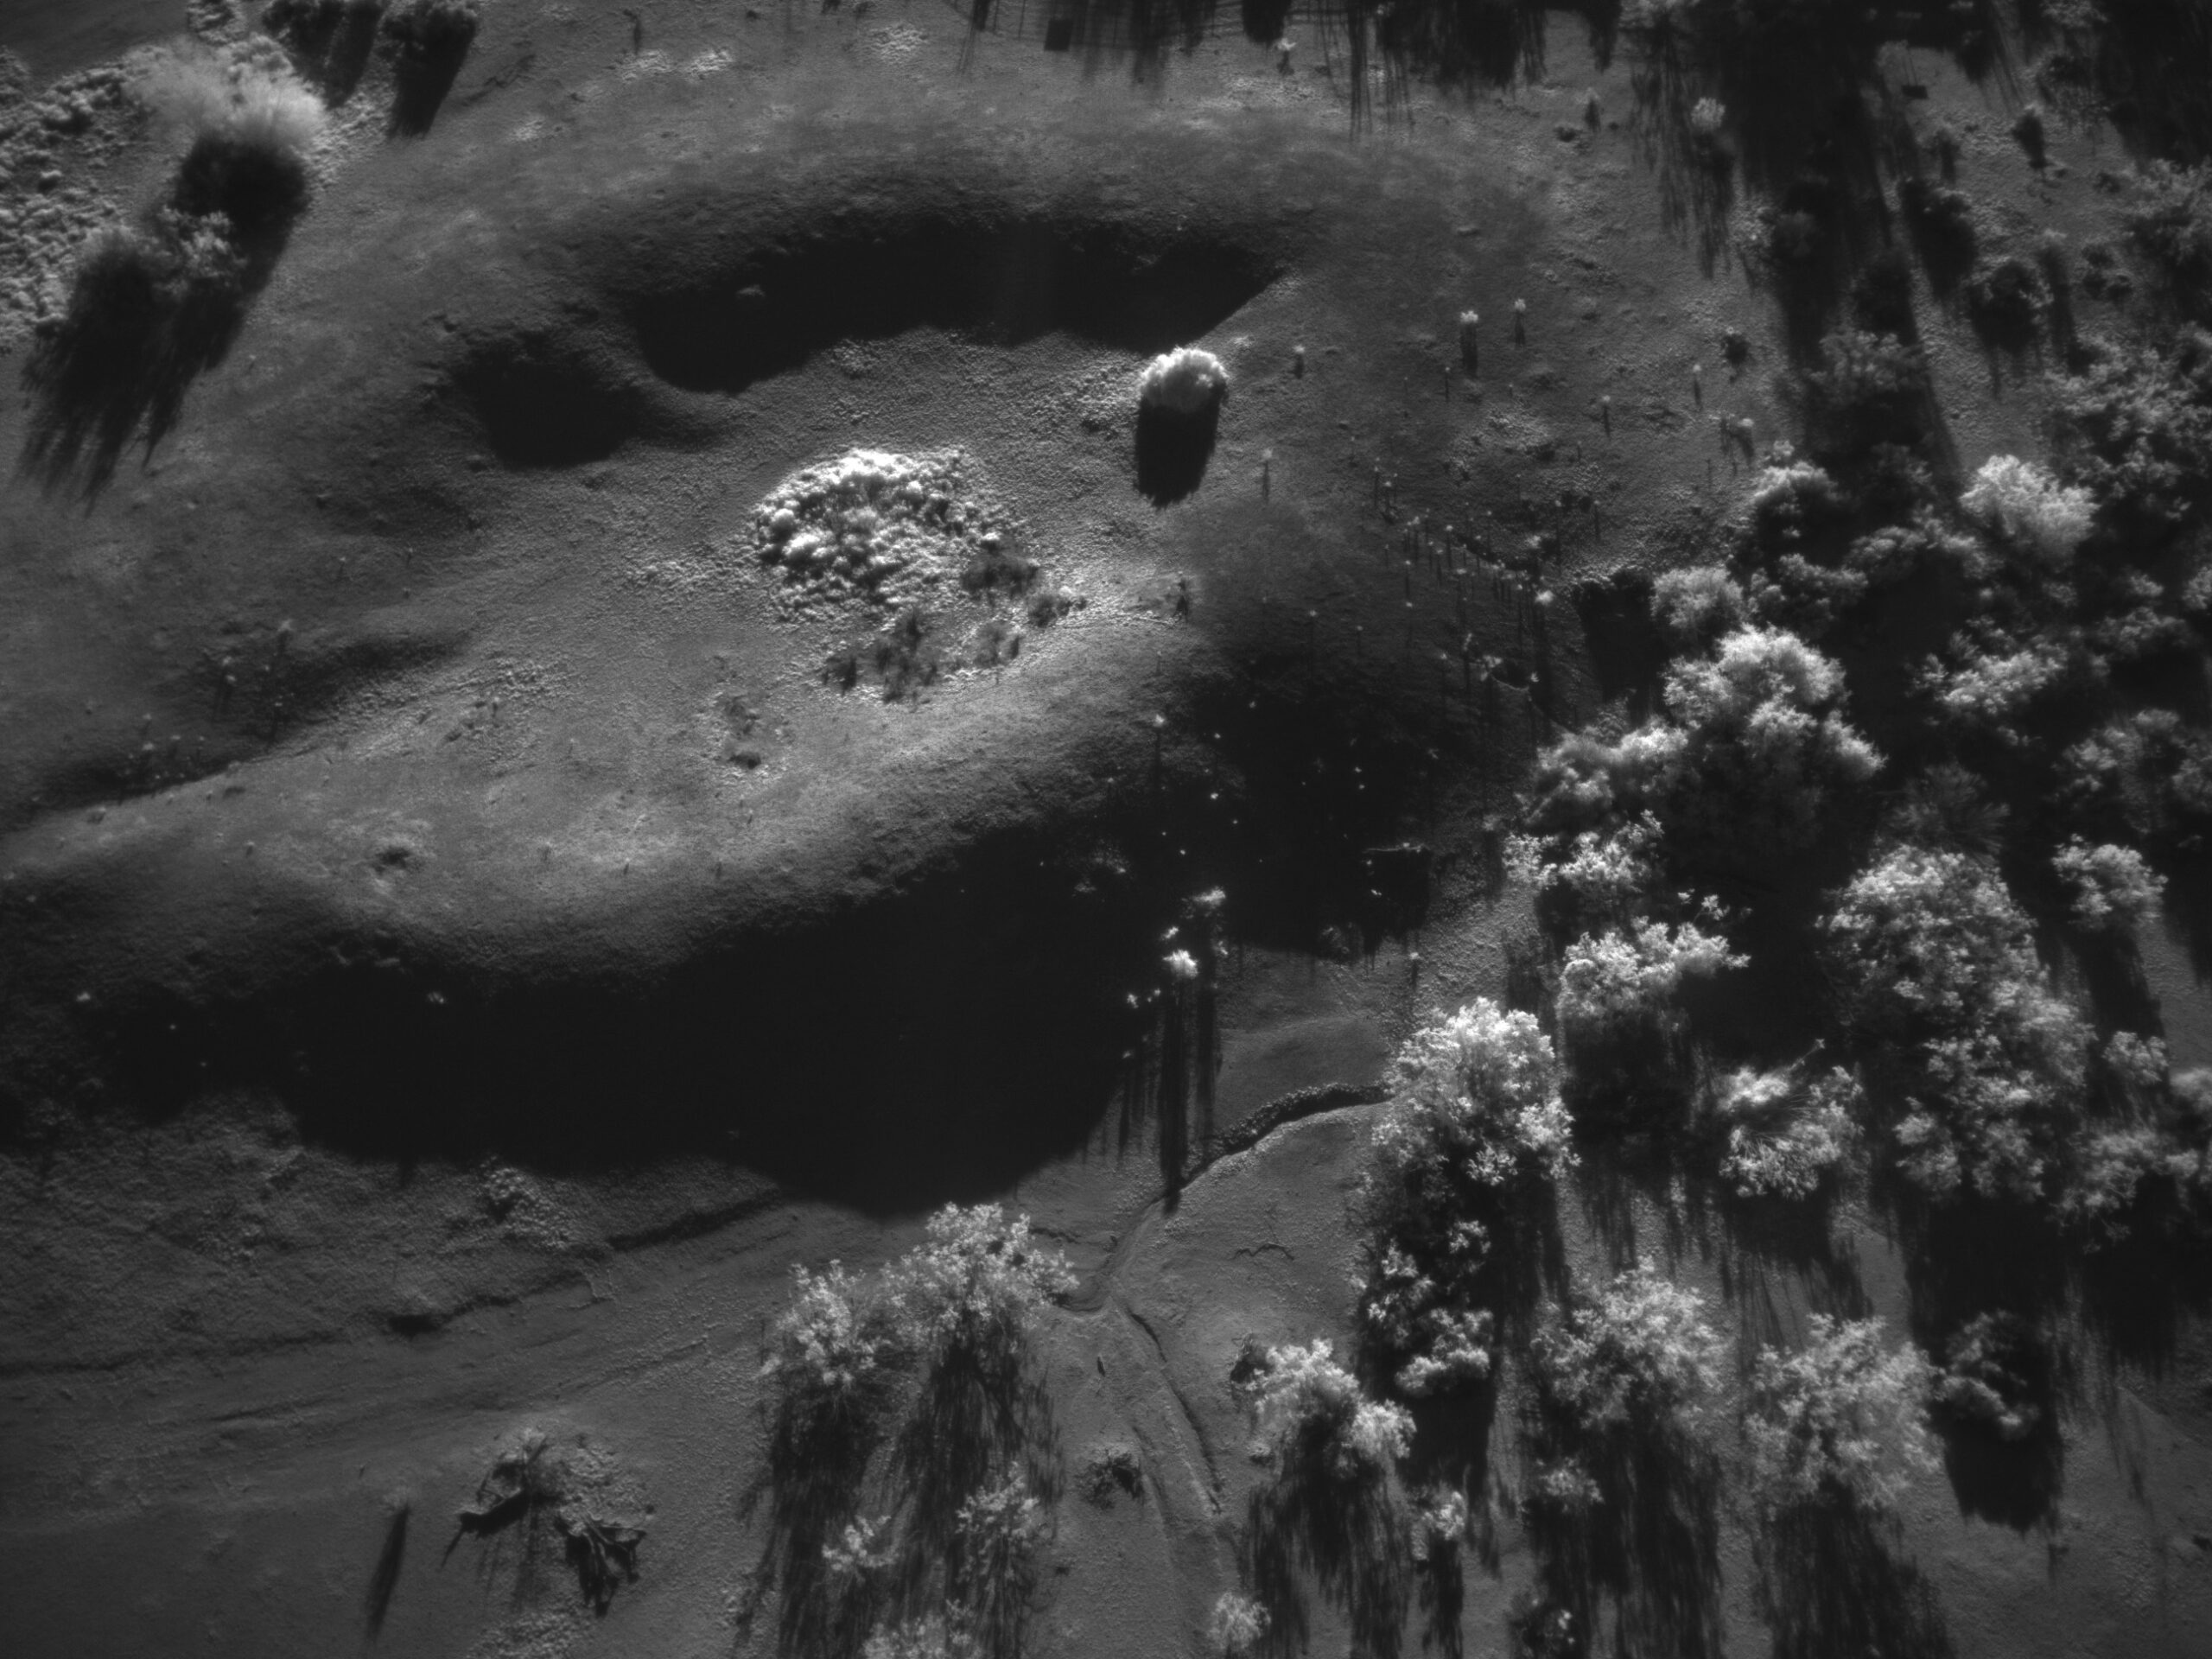
Near Infrared
Lorem ipsum dolor sit amet, consectetur adipiscing elit. Donec ex tellus, convallis consectetur est ac, vulputate convallis neque. Sed nec dui a felis scelerisque pharetra. Pellentesque molestie rutrum aliquam.
Red edge
Lorem ipsum dolor sit amet, consectetur adipiscing elit. Donec ex tellus, convallis consectetur est ac, vulputate convallis neque. Sed nec dui a felis scelerisque pharetra. Pellentesque molestie rutrum aliquam.
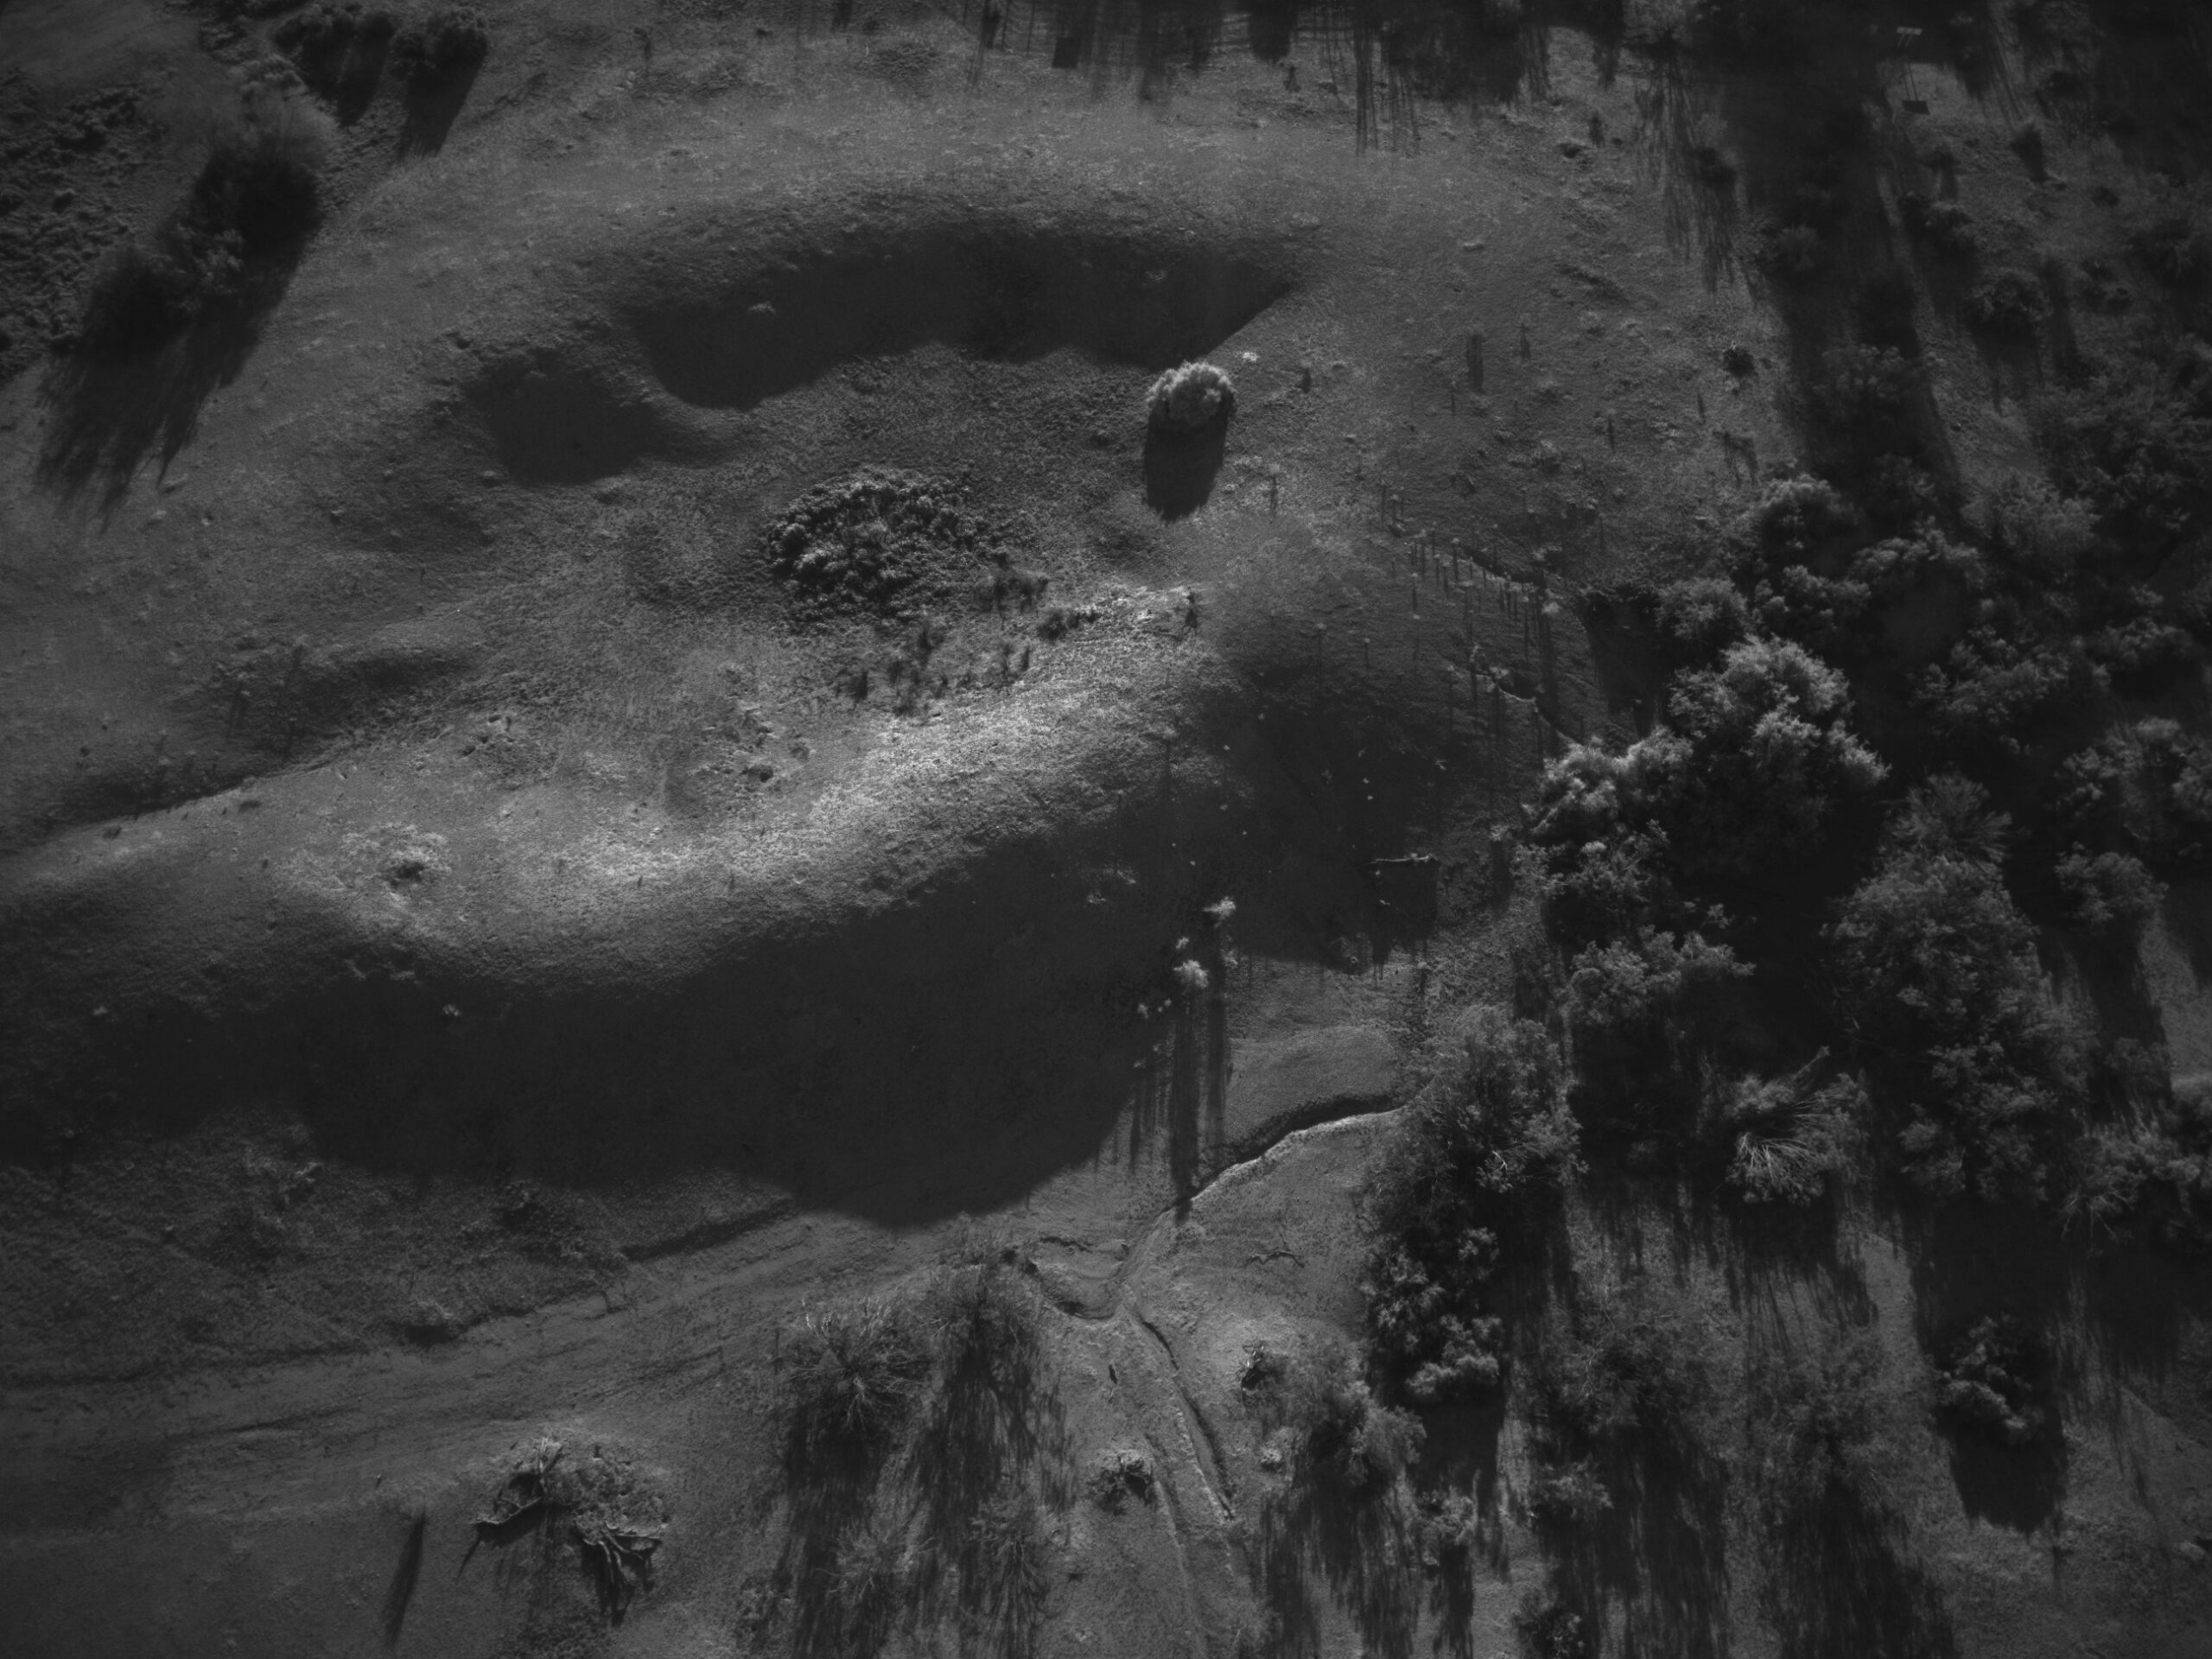
Green
Lorem ipsum dolor sit amet, consectetur adipiscing elit. Donec ex tellus, convallis consectetur est ac, vulputate convallis neque. Sed nec dui a felis scelerisque pharetra. Pellentesque molestie rutrum aliquam.
Video Output
In addition to capturing image data, the drone also took videos of the sites. [what are these??] Below are examples of the two kinds of video it captured.
Locations
The following map shows the location of the sites used as case studies for this project. More information about the sites and their features can be found on their individual pages.